Adani Wilmar Ltd (AWL), a major player in India’s edible oil and FMCG space, has seen its share price struggle to gain traction against the broader market. As of now, the Adani Wilmar share price hovers around ₹256.
Relative Strength (RS) Indicator Flags Persistent Weakness
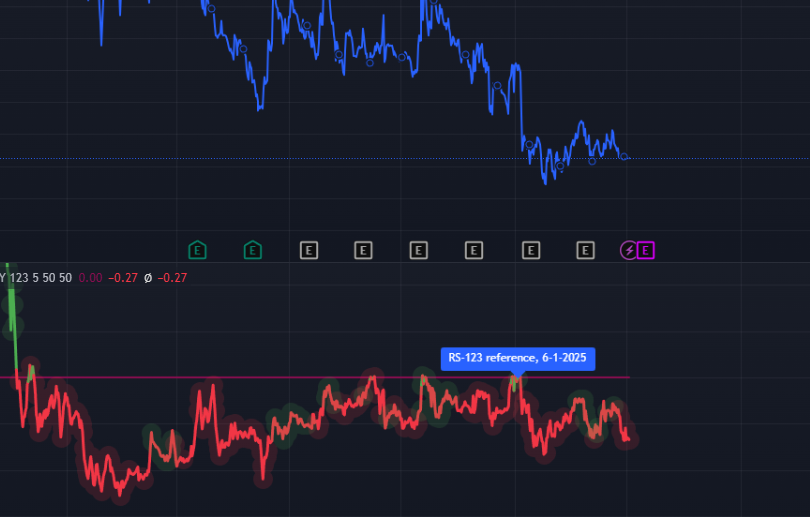
A detailed analysis using the Relative Strength (RS) Indicator—which measures a stock’s performance against a benchmark—reveals that Adani Wilmar has consistently underperformed the Nifty 50 Index over the past 6–9 months. This underperformance is not incidental. Even during periods of broader market rallies, Adani Wilmar has failed to keep pace, highlighting systemic weakness in investor sentiment toward the stock. The RS line is sloping downward, signaling that any minor rallies are less powerful than market-wide moves.
No Momentum Yet – Wait for Confirmation
Despite a respectable market cap of ₹33,330 Cr and long-term growth potential, traders and investors looking for momentum-based entries are advised to stay cautious. The key technical takeaway is this:
A strong upward breakout beyond the 52-week high of ₹403.95 is essential to confirm bullish momentum.
Until this level is breached with volume and conviction, any short-term bounce could be a trap for momentum traders. The RS line needs to turn upward—only then will the stock signal relative strength vs. the Nifty 50.
52-Week High Breakout – Why It Matters
- Technical Confirmation: A breakout past ₹403.95 will represent a reversal of trend and provide the first major RS divergence in favor of Adani Wilmar.
- Institutional Buying Signal: Breakouts from long consolidation zones often attract institutional flows, especially in mid-cap FMCG names.
- Momentum Traders’ Entry Zone: A close above the 52-week high on above-average volume could serve as a clear long trigger.
Until Adani Wilmar demonstrates relative strength against the Nifty 50 and breaks above ₹403.95, the stock remains in a no-trade or avoid zone for momentum-based strategies. Long-term investors can continue monitoring, but short-term entries should be postponed until the RS indicator shows definitive reversal signs.
Disclaimer: This analysis is for educational purposes only and does not constitute financial advice.

Viraj Jain is an active stock market trader and technical analyst with a sharp eye for identifying trend-driven opportunities. Passionate about market movements and price behavior, he specializes in analyzing crucial support and resistance levels in high-momentum stocks. Viraj is dedicated to keeping fellow investors informed with timely stock updates, chart-based insights, and actionable technical analysis that bridges the gap between market noise and informed trading decisions.