
Shares of LIC Ltd have seen a strong recovery since hitting their March 2025 lows, rebounding over 34% and re-entering the radar of both short-term traders and long-term investors. The rally, driven by improving financial performance and strong business momentum, has brought the stock close to a crucial technical resistance level, where a breakout could potentially trigger a fresh bullish phase.
Consolidation Near Resistance
The stock is currently hovering around the ₹943–₹950 zone, showing signs of consolidation just below its major resistance at ₹980.90. This level has historically acted as a barrier. A close above this mark, supported by volume, could lead to strong price expansion and a possible trend continuation.
Support and Risk Zone
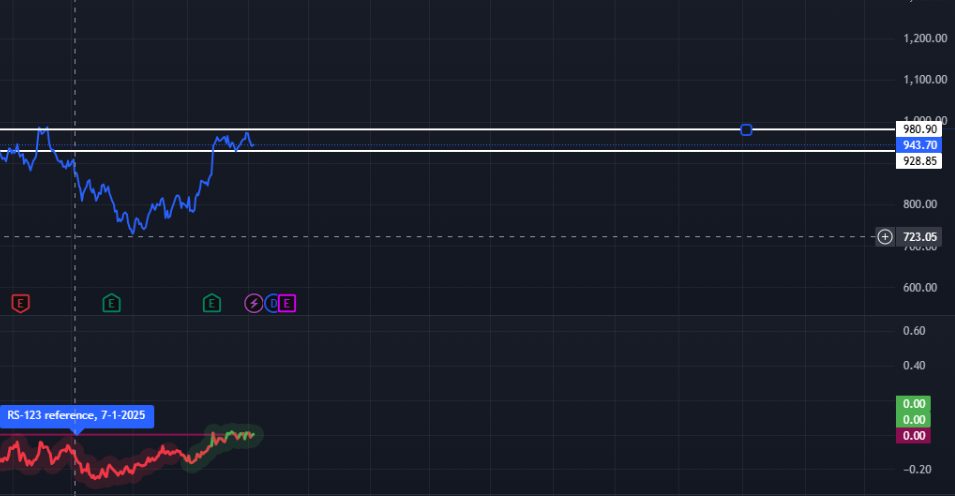
On the downside, ₹943.70 is acting as an immediate support. This level has consistently held over recent sessions and serves as a crucial stop-loss reference. A daily close below this would signal weakness and could invalidate the bullish bias in the short term.
Relative Strength Status
LIC’s Relative Strength (RS) indicator currently stands at 0, suggesting the stock is performing in line with the Nifty 50. It is neither showing outperformance nor lagging the index, which indicates a neutral sentiment in terms of market-relative strength.
Momentum Score Breakdown (StockEdge)
1-Month: 43/100 – Indicates short-term bearish to neutral phase
3-Month: 75/100 – Strong medium-term bullish trend
6-Month: 75/100 – Long-term momentum remains firmly positive
This momentum structure suggests that the stock may be resting before its next move. While short-term momentum has softened slightly, broader trend strength remains intact.
Also Read: Relaxo Footwear Share Price 9% Up in Single Day, Good to Enter?
Trading Strategy
Traders should closely monitor the ₹980.90 level. A breakout above this, accompanied by strong volume, would be a positive signal. In such a case, traders are advised not to fix a predefined target but to ride the move as long as the stock holds its strength.
Key indicators to monitor include:
- Relative Strength turning negative
- RSI dropping below 50 on daily timeframe
These would serve as early warning signs of momentum loss and should trigger exit planning.
LIC Ltd is positioned at a technically significant zone. The medium- and long-term trend remains bullish, supported by strong momentum scores. However, a convincing breakout is needed to confirm trend continuation. Traders should keep a disciplined stop-loss at ₹943.70 and approach the stock with a trailing exit strategy instead of fixed targets. The next few sessions will likely determine the stock’s next major directional move.

Viraj Jain is an active stock market trader and technical analyst with a sharp eye for identifying trend-driven opportunities. Passionate about market movements and price behavior, he specializes in analyzing crucial support and resistance levels in high-momentum stocks. Viraj is dedicated to keeping fellow investors informed with timely stock updates, chart-based insights, and actionable technical analysis that bridges the gap between market noise and informed trading decisions.